Monitoring Solar Ultraviolet-A RadiationSolar radiation received at ground level has been measured at meteorological stations for many years in most Western countries. This has not been the case in the developing world, where the potential and need for the development of sunlight as an alternative source of energy are even greater. For example, the few meteorological stations in Lebanon are equipped only to collect essential climatological data. Average climatic parameters of some relevance to solar radiation studies have been collected in Beirut (Fig. 5).
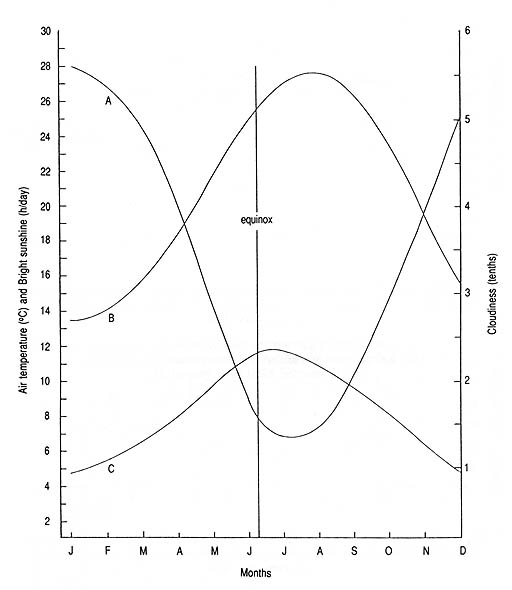 Fig. 5. Monthly mean values of (A) cloudiness, (B) air temperature, and (C) bright sunshine for Beirut from 1876 to 1957 (computed from Gingerich 1958).
MethodologyA digital radiometer (Spectroline DM-357X, Spectronics Corp., Westbury, NY, USA) was used for the solar UV-A measurements. Daily readings at noon for 4 or 5 consecutive days each week were taken. A total of 244 readings were recorded from 4 February 1985 to 26 February 1986. Advancement of the local time from 1 May to 15 October 1985 affected the collected data to some extent.Three readings were taken within 2 min on each occasion; their average was recorded. In each case, the radiometer sensor or probe was placed horizontally for horizontal readings (H), and vertically facing south for vertical readings (V). The corresponding vertical-horizontal ratios (V/H) were also calculated and recorded. The average weekly and monthly values for each of the three parameters were computed from the accumulated data. Weekly averages were used in plotting graphs for each set of data. Moving averages were used to smooth random variations in the plotted data (Berthouex and Hunter 1981).
ResultsFor incident solar UV-A radiation on a horizontal surface, the maximum monthly average occurred in June (1820 µW/cm2), and the minimum level occurred in December (479 µW/cm2) (see Appendix 1). In the south-facing vertical position, the minimum value of 275 µW/cm2 was attained in June and the peak level of 705 µW/cm occurred in February 1986. V/H ratios, like the radiation values for the horizontal position, reached a minimum of 0.15 in June and a maximum of 1.05 in December.Solar UV-A intensity varies because of changes in the earth's angle of tilt (see Appendix 2). Peak seasonal values are attained in summer (1525 µW/cm2) for the horizontal position and in winter for the vertical position (627 µW/cm2) and V/H ratio (0.870 µW/cm2). The annual mean values in each of these three cases occurred between summer and autumn. Figures 6-8 reflect the weekly random variations caused by alterations in the incident solar UV-A radiation, but the sinusoidal curves based on the moving averages are obviously smoother. The salient features are that their maximum and minimum levels almost coincide with the respective summer and winter solstices the Northern Hemisphere and that their symmetrical pattern is partitioned by the summer (June) solstice.
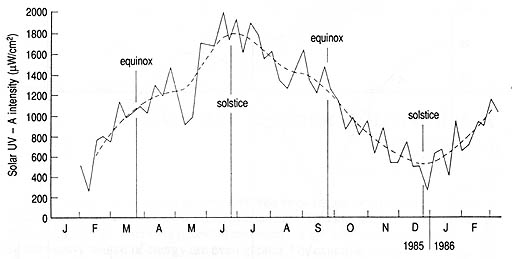 Fig. 6. Mean weekly values (solid line) and moving averages (broken line) for solar UV-A radiation intensity on a horizontal surface in Beirut from 28 January 1985 to 26 February 1986.
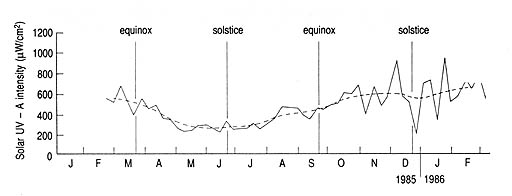 Fig. 7. Mean weekly values (solid line) and moving averages (broken line) for solar UV-A radiation intensity on a vertical surface in Beirut from 28 January 1985 to 26 February 1986.
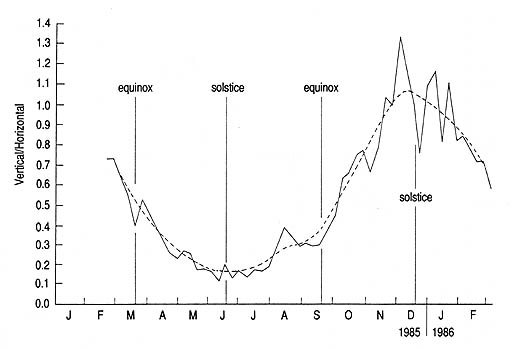 Fig. 8. Mean weekly values (solid lin) and moving averages (broken line) for the vertical/horizontal ratio for solar UV-A radiation intensity in Beirut from 28 January 1985 to 26 February 1986. For the horizontal surface (Fig. 6), the intensity reaches a peak level of some 1 800 µW/cm in June and decreases to its lowest level close to 500 µW/cm2 in December. The difference between these two levels (1 300 µW/cm ) is appreciable and important. The higher range of values in excess of the annual mean of about 1 100 µW/cm (Appendix 2) prevails from the spring equinox (22 March) to the autumn equinox (22 September). The lower range of values, falling below the annual mean, prevails in the remaining months of the year. Thus, the equinoxes form the demarcation points at which the solar altitude is at its midpoint, which corresponds to 56° in Beirut (Fig.3). Alterations in the observed intensities may occur with time (i.e., hourly and seasonal variations) because these observations apply to the midday intensities under varied climatological conditions. The annual mean value of 480 µW/cm2 (Appendix 2) for the vertical surface closely coincides with intermediate values yielded at the two equinoxes (Fig. 7). The monthly mean intensity levels greater than the annual mean form a plateau in autumn and winter with a slight dip at the winter solstice. For V/H ratios (Fig. 8), the annual mean value of 0.56 is almost equal to the ratios attained at the two equinoxes, but lower values occur in spring and summer, whereas higher ones are produced in autumn and winter. Solar UV-A intensity on a horizontal target, as measured on 3 consecutive days (7-9 October 1985) under clear-sky conditions, varied from 500 µW/cm2 at 0835 to a peak value of 1 105 µW/cm2 at 1145. It then receded to a low of 70 µW/cm2 at 1555 (Fig.9; see Appendix 3).
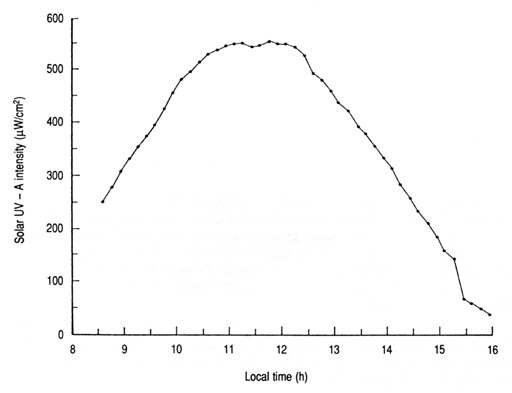 Fig. 9. Distribution of mean values for solar UV-A intensity on a horizontal surface as a function of time of day under clear-sky conditions in beirut (7-9 October 1985) (data from Appendix 3).
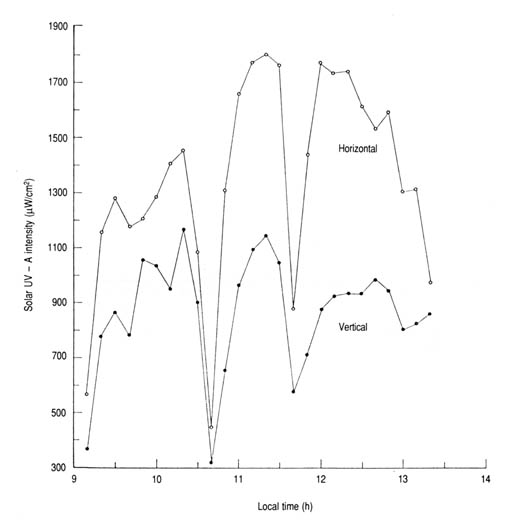 Fig. 10. Effect of target orientation on the received solar UV-A radiation throughout the day under cloudy conditions in Beirut (3 April 1985).
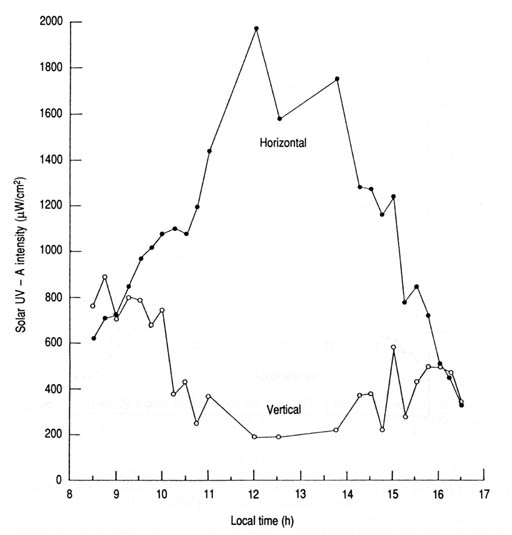 Fig. 11. Effect of target orientation on the received solar UV-A radiation throughout the day under hazy-sky conditions in Beirut (2 June 1985) (data from Appendix 4). Heavy, transient clouds lowered the received intensity on both the horizontal and vertical targets (Fig. 10). Under hazy conditions, the UV-A intensity levels for the vertical target were greatly suppressed between 0900 and 1400 (Fig. 11; see Appendix 4). This could be due to the combined effects of the high solar altitude in June (see Fig. 3), increased humidity, and light scattering by atmospheric particles. Higher radiation intensities prevailed throughout the day when the sky was clear. However, the mean percentage for the proportion of UV-A intensity on an overcast day was 5.2% compared with 4.4% for clear-sky conditions (see Appendix 5). This difference may be attributed to the diminished sunlight intensity associated with radiation absorption by cloud formations, which is more effective in longer wavelengths. With the target inclined at 35° (equivalent to Beirut's latitude), under clear-sky conditions, the incident UV-A intensity surpassed those for the horizontal and vertical positions throughout the day (Fig. 12). The differences in intensity induced by target orientation are appreciably diminished in the early morning and late afternoon (Fig. 13).
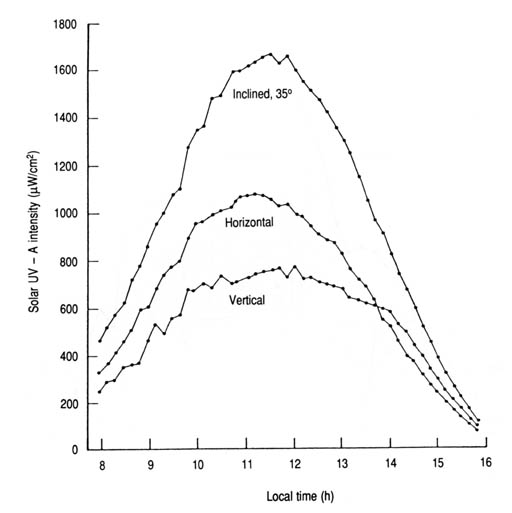 Fig. 12. Effect of target orientation on the received solar UV-A radiation throughout the day in beirut (23 October 1985).
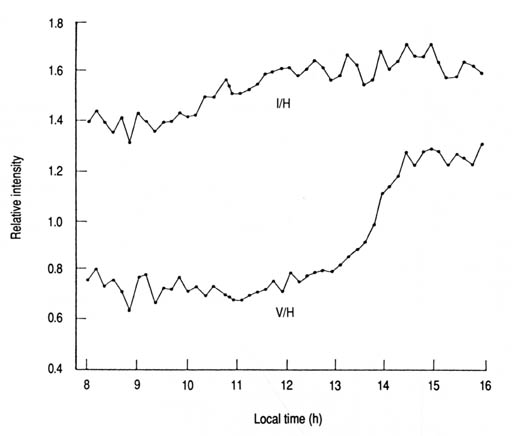 Fig. 13. Hourly trends in the ratios for solar UV-A intensity for different target orientations (inclined/horizontal, I/H; vertical/horizontal, V/H) throughout the day in Beirut (23 October 1986). For the inclined target at any time of the day, the UV-A intensity prevailing in May-June was appreciably higher than in September-October (Fig. 14). The linear regression equations observed from 1000 to 1300, at 34° N, can be used to calculate values for intensity at a given time or when a given intensity will be attained. At noon in Beirut for instance, the UV-A intensity under average conditions should be about 19 W/m2 (1 900 µW/cm2) in May-June, and about 17 W/m2 (1 700 µW/cm2) in September-October on an inclined target.
Discussion and conclusionsLebanon is among the Middle-Eastern countries that have yet to appreciably exploit the abundant sunlight as a natural source of renewable energy. Reliable data on solar radiation and its components are needed for a great variety of purposes. The variations in topography and microclimates call for data collection in representative localities on a long-term basis. The data reported herein are applicable to Beirut or any other locality with similar conditions, latitude, and elevation.The proportion of solar UVR that reaches the ground by escaping atmospheric attenuation amounts to about 4% (Brooks and Miller 1963), depending on wavelength and latitude. This attenuation is more effective for shorter UVR wavelengths, i.e., the proportion of UV-A (340 nm) to UV-B (300 nm) at 35° N should be 100:1, with a yearly mean of 165:1 Johnson et al. 1976). The UV-A radiation constitutes about 5% of the global radiation received in Beirut (see Appendix 5). Ground level UV-A radiation at any latitude seems to exceed W-B radiation, thus compensating for its weaker photobiological effects. In addition, the superior penetration power of UV-A through transparent or translucent media such as glass, plastics, and water is of practical importance (Dietz 1963; Kreidl and Rood 1965; Weast 1972). The study demonstrated an annual mean value of approximately 1 100µW/cm2 for the UV-A intensity incident on a horizontal target and 480 µW/cm2 for a south-facing, vertical target (see Appendix 2). Marked deviations from these intensity levels are largely induced by the seasonal alteration in the earth's angle of tilt and, hence, in solar altitude and atmospheric path length. At the winter and summer solstices (22 December and 22 June), solar altitudes (solar angles) at noon in Beirut would be 32.5° and 79.5°, respectively (see Fig. 3). The atmospheric path length to be traversed by the incoming UV-A radiation is inversely proportional to these angles. This, in turn, influences the magnitude of atmospheric attenuation. The maximum solar altitude attained at the summer solstice explains the establishment of the summit level in the solar UV-A radiation received on a horizontal target. The inverse situation is manifested at the winter solstice (see Fig. 3). For instance, it was observed that the daily solar UV-B in Riyadh, Saudi Arabia (24.4° N), decreased from September to December by about 40% (Hannan et al. 1984).
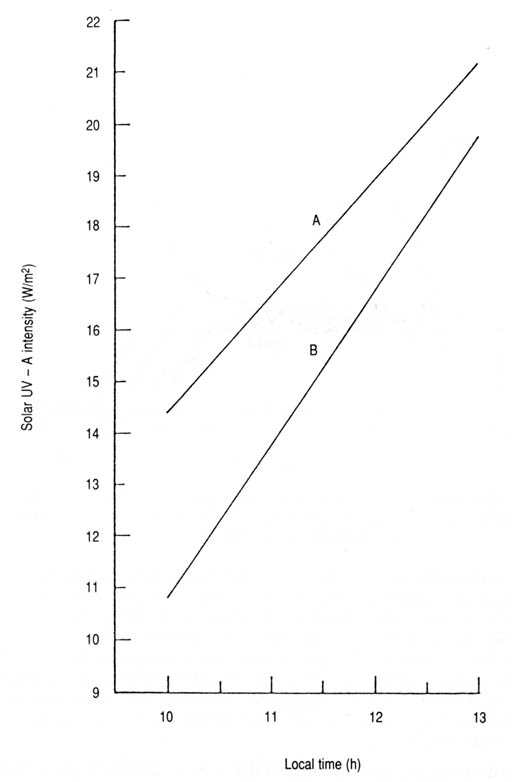 Fig. 14. Linear regression plots for the mean solar UV-A radiation received on a 25°-inclined target throughout the day for May-June (A) and September-October (B) in Beirut (1986). (A) I = 2.25T - 8.12; (B) I = 2.99T - 19.09; I, solar UV-A radiation intensity (W/m2); T, local time (h). The target orientation played an important role with respect to the intensity of the incident radiation (Figs 10-12). As a rule of thumb, the smaller the angle of incidence at the surface of the target, the greater the measured radiation intensity, and vice versa (Michels 1979). This explains partially the annual radiation pattern illustrated in Fig. 7 for the UV-A radiation on a vertical target, which contrasts the pattern on a horizontal target (Fig. 6). For maximum radiation influx, the target should face the sun continuously ("sun tracking") and be inclined at an angle equivalent to the latitude (to minimize the angle of incidence) (Figs 11 and 12). The apparent motion of the sun from sunrise to sunset imposes a profound effect on the quantity of solar radiation intercepted by a surface. The received radiation per unit area increases with the time of day to reach a peak level at noon; it then tapers off as sunset approaches (Figs 9, 11, and 12). The magnitude of the variable radiation intercepted is a function of time of day and time of year for any given latitude (McVeigh 1977; Michels 1979). Day length, a function of latitude and time of year, is important in estimating daily and annual radiation (Michels 1979). Values for Beirut range from 9.78 h in December to 14.53 h in June, with a mean of 12.14 h. The monthly mean hours of bright sunshine per day observed in Beirut from 1876 to 1957 (Fig. 5) attained a peak in June and a minimum in December. In conclusion, May to September is a particularly important period for solar radiation exposure in Beirut, characterized by longer daylight and bright sunshine hours, increased solar radiation, and diminished cloudiness. |