Solar Water DisinfectionThe germicidal action of sunlight has long been recognized (Downes and Blunt 1877), but the ecological implications and the potentials for practical applications have to be researched more thoroughly. Studies undertaken by the authors since 1979 at the American University of Beirut were aimed at solar disinfection of drinking water and oral rehydration solutions based on a batch system using clear or blue-tinted containers made of glass or plastic (Acra et al. 1980; Acra et al. 1984). The results confirm the effectiveness and feasibility of the solar decontamination of water in small quantities (<=3 L). Therefore, the possibility of applying the same fundamental principles to a continuous-flow system was investigated. Accordingly, simple prototype units were designed, and their effectiveness in decontaminating water by exposure to sunlight was assessed.
Inactivation kineticsIn a continuous-flow system operated under uniform flow and solar UV-A intensity at all points inside the transparent reactor, inactivation of the test bacteria as a function of intensity is assumed to comply with first-order kinetics (Severin et al. 1984; White et al. 1986; Scheible 1987). This exponential relationship, which is not always observed over the entire period of treatment (Gaudy and Gaudy 1980), can be approximated by the following equation:
where N is bacterial density after exposure (colony-forming units (CFU) per millilitre of effluent), N0 is initial bacterial density (CFU per millilitre of influent), N/N0 is the bacterial survival ratio, K is the inactivation rate constant (square centimetres per microwatt minute, cm2/µW min), I is the intensity of received solar UV-A radiation (microwatts per square centimetre), T is time of exposure to solar UV-A radiation (min), and e is equal to 2.7182. Units for I, T, and K may be substituted with watts per square metre, hours, and square metres per watt hour (m2/W h), respectively. The dimensionless value of the constant is a direct measure of bacterial sensitivity to solar UV-A radiation. The experimental K value for each test organism can be computed from equation 1 and is represented by the slope of the corresponding survival curve. Exposure time (T) corresponds to the residence time of the water as it flows through from the inlet to the outlet port of the reactor. Its value can be calculated from the following expression:
where T is time of exposure to solar UV-A radiation (minutes), Q is total capacity of the transparent part of reactor (litres), and V is the flow rate of water passing through the reactor (litres per minute). If the bacterial survival ratio (N/N0) is to be expressed in terms of percentage, then equation 1 changes:
where S is bacterial survival (percent). Other symbols and units are the same as for equation 1. Fluence (F), or radiation dose, is the product of solar UV-A intensity (I) and exposure time (T).
By substituting F for IT, equation 3 can be expressed as follows:
where the symbols and units are the same as for equations 1 and 3. Survival curves are plots of the mean values obtained from some congenial experiments for percentage bacterial survival (S) as an exponential function of solar UV-A intensity (I), or fluence (F). The computed values are derived by the application of either equation 3 or 5.
The solar reactorsThe prototype solar units in the first stage of the experiment were installed on the roof of a university building (Figs 15 and 16). Artificially contaminated water in the storage reservoir (150 L) was pumped to the constant head tank, from where the flow would then be delivered by gravity to the solar reactor at desired flow rate.
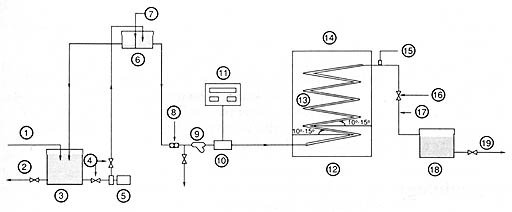 Fig. 15. Layout of type I solar reactor facility. 1, water feed; 2, drain; 3. storage reservoice containing contaminated water; 4, gate valve; 5, pump; 6, constant head-tank; 7, overflow; 8, flow regulator; 9, strainer; 10, flow meter; 11, digital flow meter panel and control; 12, solar reactor; 13, serpentine transparent tube; 14, inclined fram support (facing south); 15, air valve; 16, globe-valve; 17, effluent; 18, storage tank; 19, distribution. Solar reactor IA (Fig. 15) consisted of a serpentine-shaped, transparent tube made of Pyrex glass (borosilicate type) supported by a south-facing metal frame. The angle of inclination was set at 35° to approximate the latitude for Beirut (34° N) for optimum solar irradiation. The dimensions of the glass tubing were as follows: total length, 13.4 m; outer diameter, 22 mm; wall thickness, 1.5 mm; capacity, 4.87 L; angle between segments, 25 +/- 5°. The latter feature prevented air-gap formation by inducing an upward flow of floating air bubbles. Solar reactor IB was a standby unit, used for comparison purposes. This unit differed from the first one in dimensions: total length, 12.0 m; outer diameter, 25 mm; wall thickness, 1.5 mm; and capacity 5.20 L. The two systems were independent and could be operated either separately or concurrently.
 Fig. 16. Layout of type II solar reactor facility. 1, water feed; 2, drain; 3, storage reservoir containing contaminated water; 4, gate valve; 5, pump; 6, constant head-tank; 7, overflow; 8, flow regulator; 9, strainer; 10, drain; 11, flow meter; 12, digital meter panel and control; 13, solar reactor; 14, 4-L glass bottles; 15, transparent spiral tube; 16, storage tank; 17, distribution. Type II solar reactors (Fig. 16) were developed for use at a later stage in the project to benefit from the expansion in the capacity of the transparent components exposed to sunlight within a minimum space. Solar reactor IIA consisted of an array of two Pyrex glass containers and a Pyrex glass helix. The capacity of each container was 4.23 L and the dimensions of the helix were as follows: total length, 10.52 m; outer diameter, 12 mm; wall thickness, 1.0 mm; capacity, 1.0 L. Thus, the total capacity of this reactor was 9.46 L. Solar reactor IIB differed in that an array of four containers were connected in series to the glass helix, thereby increasing the total capacity to 17.92 L, enhancing flow and output.
MethodologyA fresh batch of 150 L of chlorinated tap water would be admitted into the storage reservoir l or 2 days in advance to allow the chlorine residual to diminish below 0.05 mg/L before its artificial bacterial contamination. The physicochemical quality of the water was established three times at intervals of 1 month (Table 2).
Between 1 and 2 h before each experiment, a batch of water would be contaminated with 0.2-0.7% fresh clarified sewage obtained from the main city sewer. This maintained the population of a specific test organism within a realistic concentration range of 50-5000 cells/mL. The sewage was freed from much of its suspended particles by settling or filtering, and was thoroughly mixed with water to ensure homogeneity. A pure culture of Escherichia coli, maintained on refrigerated nutrient agar slants before harvesting and transfer to lactose broth for overnight incubation at 35.5 +/- 0.5°C, was used as a substitute for sewage in some of the experiments. Each of the three selected fecal-indicator bacteria (coliforms, Streptococcus faecalis, and E. coli) was cultured for enumeration following standard bacteriological procedures (Difco Laboratories 1977; APHA 1985). The water inoculum ranged from 5 to 500 µL, and each set of three or four inoculated plates was run in duplicates. The water samples were rushed to the laboratory in the same building for immediate bacteriological analysis, avoiding their exposure to sunlight or even indoor illumination. Delays could yield false low results (Fujioka and Narikawa 1982; Acra et al. 1980; Acra et al. 1984). Coliforms and E. coli were assayed for viability by surface streaking on desoxycholate lactose agar, whereas S. faecalis was assayed on KF Streptococcus agar (both media from Difco Laboratories, Detroit, MI, USA, or Bio-Merieux, Charbonnieres les Bains, France). Solar UV-A intensity received on the surfaces of the reactors was measured in triplicate at timed intervals during each experiment with the same digital radiometer described earlier. Fluence (F) was calculated from the average intensity and the exposure time as explained before. Solar irradiation experiments were generally carried out between 0930 and 1330. Sampling and measurement of the desired parameters was carried out at short intervals (25-30 min) because of the nonuniformity in the radiation intensity. Irradiated and nonirradiated samples of water were collected in duplicates from the inlet and outlet ports of the reactors: one for an immediate temperature reading and the other in a sterile container for bacteriological testing. At the same time, average values for several readings of the flow rate and the solar UV-A intensity were recorded for each interval, as well as the volume of effluent water. The residence time for each interval, assumed to represent the solar exposure time, was calculated from the relevant flow rate and capacity of the experimental reactor. In all experiments, the readings for the first interval were discarded, and only the overall means for the intervals per experiment were pooled to provide data for the computations based on the equations given before. Averaged data for the influent and effluent samples for a group of congenial experiments were considered for the evaluation of each reactor to provide more reliable results by stabilizing the variances. The Statistical Conversational Package for the Social Sciences (SCSS) was used for data analysis on an IBM VM-370 computer.
ResultsSix trial experiments were run in mid-1986, after which the two prototype units with solar reactors IA and IB functioned satisfactorily. The experiments with these two reactors were 11 for coliforms, 11 for S. faecalis, and 6 for cultured E. coli (13 August-18 December 1986). In addition, four experiments were run on reactors IIA and IIB for coliforms (18 December 1986-22 January 1987). As the experimental results yielded by the solar reactors IA and IB were found to be comparable, the data for these two units were pooled for statistical analysis and evaluation.The data were recorded considering the bacterial counts as the dependent variable and water temperature, flow rate, and solar W-A intensity as the independent variables (see sample data sheet in Appendix 6). The data pertaining to solar reactors IA and IB for coliforms, E. coli, and S. faecalis are summarized in Appendices 7, 8, and 9. These statistics were applied in equation 5 for computing the exponential relationship between solar UV-A fluence (F or IT) and percentage bacterial survival (S). This approach tends to eliminate any bias introduced by experimental errors and uncontrollable fluctuations in the experimental conditions. It also considers uniform flow (plug flow) through the reactors and, consequently, the exposure time calculated for each interval on this basis. Mean preliminary values obtained with reactors IIA and IIB are shown in Appendix 10. The percentage survival curve for each of the three fecal indicator bacteria relate to the computed data obtained with reactors IA and IB (Figs 17, 18, and 19). In each case, the corresponding exponential equation is recorded together with the specific values for the statistical significance levels. In all three cases, the p value is below 0.001, indicating a high significance level. Insufficient data for reactors IIA and IIB precluded computation of the exponential survivals and presentation of the graphs. Samples of the effluent from the reactors were kept periodically at room conditions or in the dark for a day or more to check for bacterial regrowth. Regrowth was not observed upon culturing on the usual media in any of these cases or in the batch system.
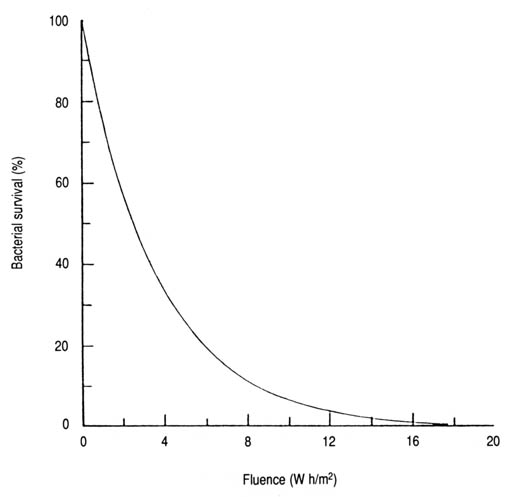 Fig. 17. Survival of coliforms as a function of solar UV-A fluence. Based on data from Appendix 7 and then derived exponential equation3: S = 100e-0.279 IT (n = 12, r = -0.946, p < 0.001).
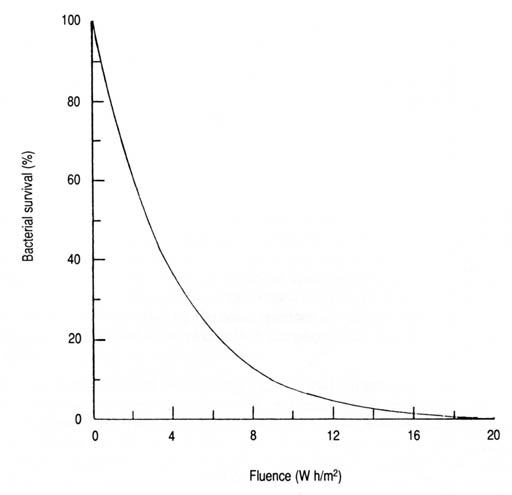 Fig. 18. Sruvival of Streptococcus faecalis as a function of solar UV-A fluence. Based on data from Appendix 8 and the derived exponential equation 3: S = 100e-0.259 IT (n = 12, r = -0.949, p < 0.001).
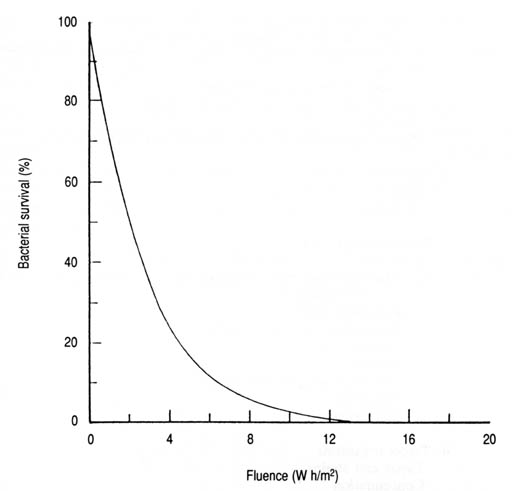 Fig. 19. Survival of Escherichia coli as a function of solar UV-A fluence. Based on data from Appendix 9 and the derived exponential equation 3: S = 100e-0.362 IT (n = 7, r = -0.984, p < 0.001).
DiscussionData from previous batch-inactivation experiments provided baseline information and criteria for the design, operation, and expected performance of the continuous-flow prototypes (ACM et al. 1980; Acra et al. 1984). They included the following:
A constant head with a low to moderate pressure was deemed necessary to maintain a uniform inflow of feed water that could be regulated to provide an adequate exposure time for solar decontamination. The strainer (Figs 15 and 16) was intended to supplement prefiltration of the feed water, if needed. Solar reactors IA and IB were constructed with Pyrex glass tubing for three reasons:
The south-facing orientation of solar reactors IA and IB and their inclination fixed at 35° from the horizontal provided the necessary conditions for the optimal influx of solar radiation. Other angles of inclination could prove just as effective because of the rounded shape of the tubes, except for upright positions for fear of shading at periods of high solar altitude. The situation is somewhat different in the case of solar reactors IIA and IIB as the components were made to stand upright. It is possible, however, to keep them inclined with appropriate supports. While designing the prototype solar reactors, the criteria that would enhance the transmittance of the most effective biocidal wavelengths of solar radiation was considered. The design of the various types of reactors with artificial UVR sources, their hydraulic characteristics, and performance would be a useful information source, although they differ from solar reactors with respect to radiation source and orientation (Qualls et al. 1983; Severin et al. 1984; Kreft et al. 1986; White et al. 1986; Scheible 1987). The flow of contaminated water through the reactors was maintained within 4-37 L/h, which corresponded to a range of exposure time of 66-8 min (Appendices 7-10). To minimize the cost/benefit ratio, it would be important to maximize the flow rate and, thus, the output of the facility. This may be accomplished, at least in part, by either increasing the capacity of the reactor without significantly diminishing the transmitted solar energy or replicating the modules, i.e., increasing the number of reactors connected in series (Fig. 16).
The test water used in this study can be described as saline, hard, and slightly turbid (Table 2). It also contained trace amounts of organic matter contributed by the added sewage or lactose broth in the case of E. coli culture. Certain water characteristics could influence the survival of microorganisms and, hence, modify the inactivation effect of sunlight. These factors include inorganic salts, organic nutrients, predators, bacteriophages, bacterial toxins, and surface attachment (Carlucci and Pramer 1959; Nabbut and Kurayiyyah 1972; Chamberlin and Mitchell 1978; Gaudy and Gaudy 1980; McCambridge and McMeekin 1981; Moss and Smith 1981). Another important factor is associated with the presence of suspended particles that would shield the microorganisms from exposure to radiation (Qualls et al. 1983, 1985; Scheible 1987). Because of the low turbidity levels of the contaminated waters used (1.3 +/- 0.4 Nephelometric Turbidity Units [NTU]), sunlight attenuation by absorption in the effective wavelengths is not expected to be significant. Stresses imposed upon the test organisms by one or more of the potentially detrimental factors mentioned (loss of dissolved gases, variations in the water pH, temperature, etc.) could have enhanced the solar inactivation effect. Nevertheless, the bactericidal action of solar UVR appears to play a dominant role, and a synergistic action is desirable from a practical viewpoint. We inferred from trial experiments with both the batch and continuous-flow systems that high-density bacterial populations show lower sensitivity to solar radiation compared with those with a low or moderate density. This phenomenon was reflected in the need for prolonging the exposure time for bacterial populations in excess of a few thousand cells per millilitre (Gaudy and Gaudy 1980; Abshire and Dunton 1981). These facts have consequently prompted this study to avoid the use of the conventional bacterial density range of 108-1010 viable cells/mL (Nabbut and Kurayiyyah 1972; McCambridge and McMeekin 1981; Moss and Smith 1981; Tyrrell and Souza-Neto 1981). The use of normal intestinal bacteria as indicators of fecal pollution is universally acceptable for monitoring and assessing the microbial quality of water supplies (Feachem et al. 1983; WHO 1987). The bacteria used in this study were selected because they are more resistant than the pathogens to disinfection by physical or chemical agents. Their photoinactivation is, therefore, an apropos assumption that the pathogenic bacterial contaminants in water would also have been similarly affected. The spectrum curve for the inactivation of coliforms was determined (Fig. 20) based on the expression that relates the relative bacterial inactivation rate (percent) with the wavelength of transmitted light (Acra et al. 1980; Acher 1985). Relative inactivation is in reference to the inactivation rate at 260 nm. Locally made glass jugs of different colours and hues were used during the batch experiment. The spectral transmission curves were determined spectrophotometrically from specimens of each of the coloured glasses. The wavelengths corresponding to 50% light transmittance were used to compute the exponential equation. It is inferred from this curve that the relative photoinactivation rate decreases exponentially as the wavelength of sunlight increases. In the most active UV-A region, for example, the relative inactivation rates range from 75 to 50% at 320 and 400 nm, respectively. Those for the violet and blue regions are lower, ranging from 50% at 400 nm to 30% at 490 nm. At the midpoints in these two regions, the relative inactivation rates diminish from 60% at 360 nm to 40% at 445 nm. This accounts for an inactivation efficiency of about 1.5 times for UV-A compared with that for violet-blue light.
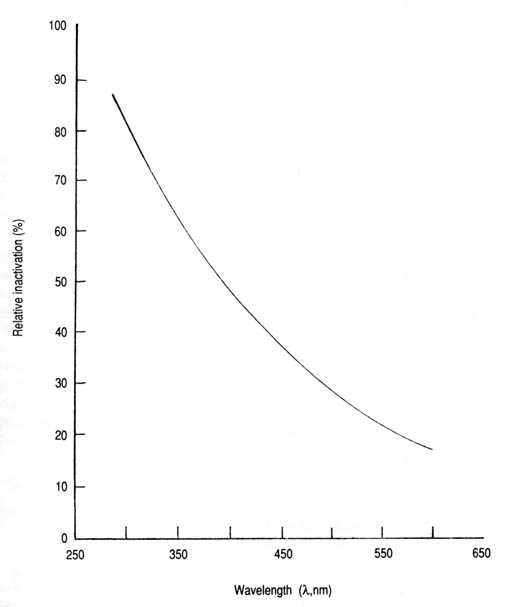 Fig. 20. Action spectrum for the inactivation of coliforms in contaminated water exposed to sunlight in coloured transparent glass containers. Relative inactivation (%) = 398e-0.0051[lambda] (n = 6, r = -0.925, p < 0.01). The curve in Fig. 21 was derived from the same set of data for the coliform action spectrum. The time required for sunlight to inactivate 99.9% of the initial coliform cells (T99.9) increases exponentially with wavelength. The T99.9 values for solar UV-A range from 90 min at 320 nm to 165 min at 400 nm. For the violet-blue region, it rises to 310 min at 490 nm. However, sunlight is polychromatic and, as such, may introduce the complicating factor of synergism or antagonism as opposed to monochromatic light or a confined wavelength band.
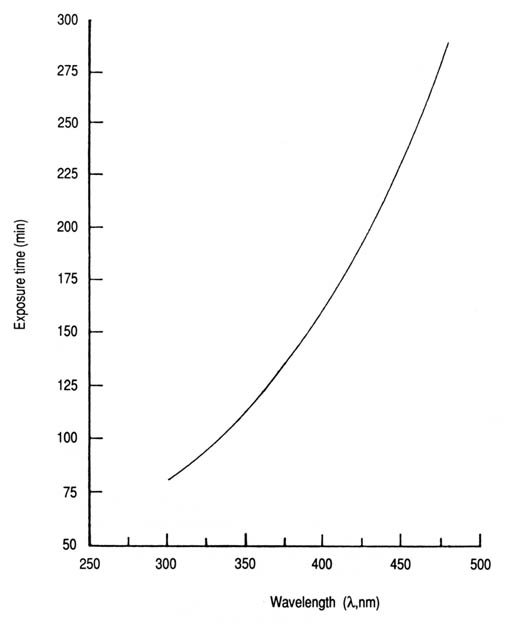 Fig. 21. Time required to inactivate 99.9% (T99.9) of coliforms in contaminated water exposed to sunlight in coloured transparent glass containers, as a function of wavelength. T99.9 = 9.4e0.0071[lambda] (n = 5, r = 0.992, p < 0.001). As stated earlier, solar UVR at wavelengths below 290 nm does not reach ground level. In addition, radiation in the UV-B spectral region (280-320 nm) is not transmitted through ordinary glass. Pyrex glass, however, can transmit low levels of UV-B at wavelengths greater than 300 nm. Attenuation through absorption by the test water in glass containers or that flowing through a solar reactor would achieve further reductions in the incident UV-B radiation. It can be assumed, then, that natural UV-B radiation plays an insignificant role in solar inactivation of bacteria wherever glassware in the form of containers or tubes is used as solar reactors. This, together with the preceding information derived from the coliform action spectrum, leads to the conclusion that the natural UV-A radiation plays the dominant role in the photodecontamination process as applied in these studies. The mean values of the measured parameters (bacterial survival, solar UV-A intensity, flow rate, and water temperature) are summarized in Appendices 7,8, and 9, for the selected fecal indicator bacteria (E. coli, S. faecalis, and coliforms). The statistics for percentage bacterial survival (S) were exponentially regressed against those for fluence (F) according to equation 5. Thus, an adequate set of computed values for S and F were obtained for plotting the survival curve relevant to each test organism (Figs 17-19). If desired, the computed values for exposure time (7T) or radiation intensity (I) can be derived by substitution in equation 4. However, the fitness of the experimental mean values with first-order kinetics is verified in the case of each organism by the high levels of significance (p < 0.001). The summarized fluence values (Table 4) needed to inactivate each of the test organisms to levels of 90, 99, and 99.9% and their respective inactivation rate constants (k), show that S. faecalis required relatively more solar UV-A fluence for photoinactivation than the other two indicator bacteria; E. coli was the most sensitive. The T99.9 fluence values, for instance, were approximately 27, 25, and 19 W h/m2 for S. faecalis, coliforms, and E. coli, respectively. Analysis of variance of the experimental mean values for the percentage survival versus solar UV-A fluence (Appendix 11) showed a statistically significant difference. However, no significant correlation was observed between the mean water temperature values and percentage bacterial survival at the 0.05 significance level. This agrees with reports that UV sensitivity of bacteria is only slightly influenced by temperature in the range of 5-37°C (Cheremissinoffet al. 1981). For an average solar UV-A intensity on a horizontal target at midday in Beirut of 10 W/m2, these fluence values would correspond to exposure times (T) of 160, 150, and 115 min, respectively. The T99.9 value of 150 min for coliforms falls within the range of the corresponding mean values obtained for the same organism in a previous study involving a batch exposure system, which yielded T99.9 values of 90 min at 320 nm and 165 min at 400 nm (Fig. 21).
In additional single experiments run simultaneously by the batch system using contaminated water in 300 mL, round Pyrex flasks (one for each type of organism inoculated), the time required for complete photoinactivation of certain enteric pathogens was as follows: Salmonella paratyphe, 90 min; E. coli, 75 min; Salmonella typhi and Salmonella enteriditis, 60 min each; Salmonella flexneri, 30 min; and Pseudornonas aeruginosa, 15 min. It would be justifiable to infer from these findings that:
The comparisons made between the experimental results cannot be sound and valid unless the potentially significant variables are strictly controlled by proper experimental design. For instance, the experimental data involving the use of a pure culture of E. coli (Appendix 9, Fig. 19) contrasts with the use of sewage as a source for water contamination in the case of coliforms and S. faecalis (Appendices 7 and 8, respectively). Nevertheless, sewage-contaminated water is more realistic for experiments in these cases. Differences in experimental design, experimental conditions, and measurement units could add complexity to comparisons with data reported elsewhere, in particular for those studies based on the use of artificial, monochromatic UVR (Abshire and Dunton 1981; Kubitschek and Doyle 1981; McCambridge and McMeekin 1981; Chang et al. 1985; Haeder 1986) in contrast to those based on filtered sunlight (Jagger 1975; Tyrrell and Souza-Neto 1981). For instance, the germicidal action of solar UVR has been studied on E. coli and coliforms in sewage-treatment lagoons for which the measurement of solar radiation was restricted to the UV-B spectrum (Calkins et al. 1976; Moeller and Calkins 1980). These investigations were based on the grounds that natural UV-B radiation with its relatively strong biocidal effects can penetrate the exposed surfaces of the wastewater. However, concomitant and potential effect of the solar UV-A was not considered. The inference that fecal streptococci were more resistant to sunlight than fecal coliforms has also been reported (Fujioka and Narikawa 1982), but without enough solar UVR data to compare with this study. On the basis of their relative susceptibility to solar radiation, the bacteria that occur in seawater have been ranked as follows (McCambridge and McMeekin 1981): Klebsiella pneumonia > E. coli > Salmonella typhimurium, Streptococcus faecium, and Enterobacter aerogenes. In addition, using artificial UV-B radiation and microbial suspensions in buffered sterile water, the resistance of some microorganisms has been ranked as follows (Chang et al. 1985): A. castellanii cysts > Bacillus subtilis spores > simian rotavirus > standard plate count > S. faecalis > total coliforms > E. coli > Streptococcus aureus > Shigella sonnei > S. typhi. It has been reported that the inactivation of virus, bacterial spores, and amoebic cysts required 3-4, 9, and 15 times, respectively, the UV-B fluence required for E. coli (Chang et al. 1985). Similar lists have been published for UV-C radiation showing that some mould spores required 50 times the fluence required for E. coli at 254 nm (Legan 1980). For Beirut and other localities with similar conditions, the predicted exposure times required to inactivate the three indicator bacteria to a specified percentage level under various solar UV-A intensities are shown in Figs 22-24 (Appendices 12-14). For instance, 62 min is the predicted required exposure time (T) to inactivate 99% of the coliform bacteria in water with an incident solar UV-A intensity (I) of 16 W/m2. This can also be expressed in terms of fluence (F = IT) as 16.5 W h/m2. The three commonly used percentage inactivation levels (T90, T99, and T99.9) are related mathematically as follows:
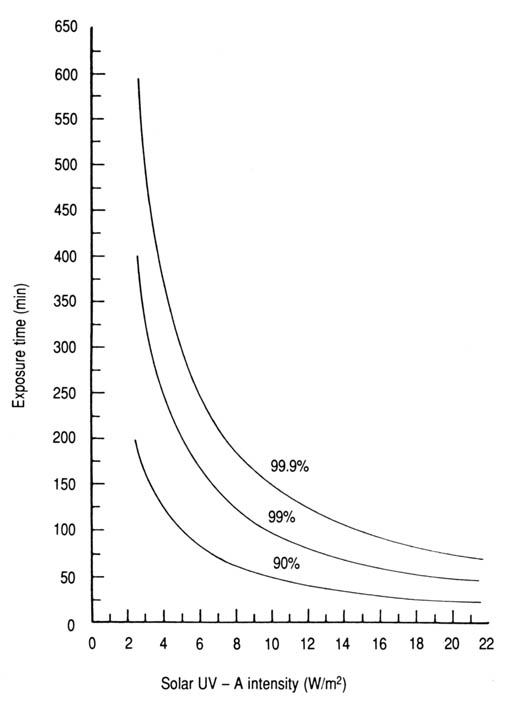 Fig. 22. Time required to inactivate 90, 99, and 99.9% of coliforms in contamintae water as a function of solar UV-A intensity (data from Appendix 12).
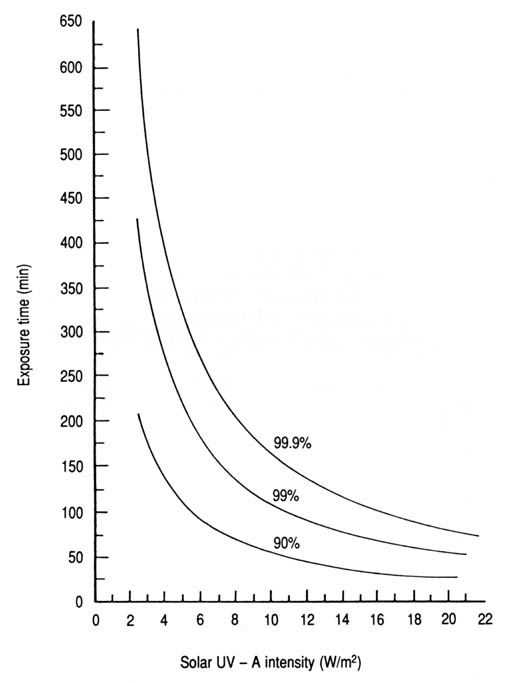 Fig. 23. Time required to inactivate 90, 99, and 99.9% of Streptococcus faecalis in contaminated water as a function ofsolar UV-A intensity (data from Appendix 13).
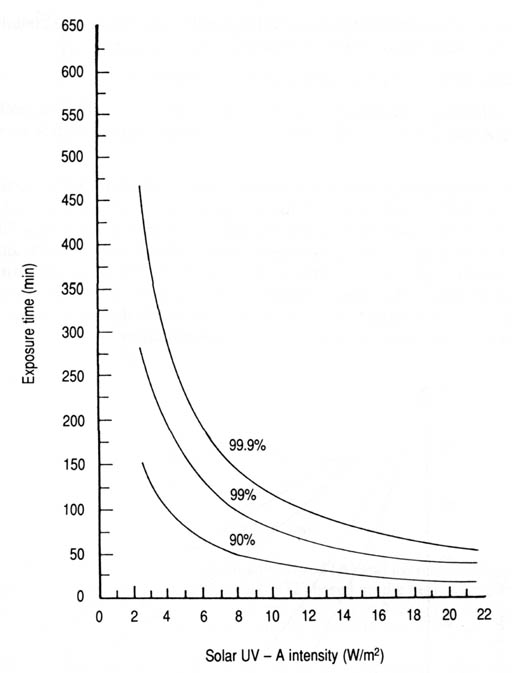 Fig. 24. Time required to inactivate 90, 99, and 99.9% of Escherichia coli in contaminated water as a function of solar UV-A intensity (data from Appendix 14).
Conclusions and recommendationsThe prototype solar reactors IA and IB (Fig. 15) operated and performed satisfactorily during the experiments. However, productivity could be increased by increasing reactor capacity or replicating reactor modules. An increase in reactor capacity magnifies the dimensions of the unit. Transparent reactor tubings with internal diameters of 10-15 cm could be practical if affordable. A 10-fold increase in diameter would allow for a 100-fold increment in capacity and, thereby, in output.Strict adherence to the minimum fluence requirement for, say, a T99.9 level of photoinactivation of the selected fecal indicator bacteria is mandatory. In fact, an additional fluence requirement of 10-20% is highly recommended as a safety margin. The kind of bacterium to serve as a "reference" for solar disinfection should be related to the relative sensitivity of the organism to solar UV-A. Streptococcus faecalis has proven in experiments to be the most resistant of the three fecal-indicator bacteria (Table 4). It has also been shown to be more resistant to photoinactivation than several of the enteropathogenic bacteria (McCambridge and McMeekin 1981). Consequently, enumeration of S. faecalis is proposed as a suitable tool for designing or monitoring water-disinfection processes by sunlight. Therefore, a minimum UV-A fluence of 17.8 W/m2 would be required to decontaminate water to a T99.9 level, to which a safety margin of 1.8-3.6 W/m2 should be added. The type II solar reactor possesses some advantageous features with potential for
Growth of phytoplankton that attach to the inner walls of the solar reactors leading to diminished light transmission was one of the observed potential problems. No visible growth occurred, possibly because of the loss of soluble gases and lack of atmospheric contact for replenishment, the absence of sufficient quantities of nutrients, and the elimination of conditions for commensalism, among other minor factors, which seem to be the main reasons for interface attachment (Marshall 1978). In addition, microorganisms attached to the inner surfaces of the tubes are likely to be more susceptible to incident radiation. Under field conditions, it would be essential to limit the disinfection process to that part of the day with sufficiently bright sunlight. The alternating "on" and "off" operations could be handled in one of the following ways:
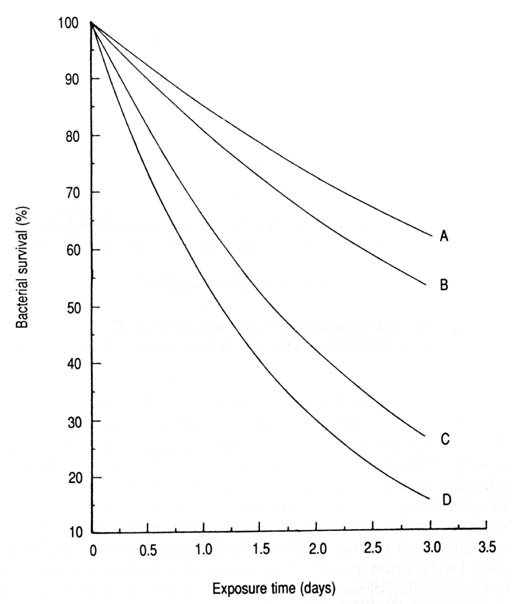 Fig. 25. Comparative survival of bacteria in estuarine water exposed to sunlight. Computed from McCambridge and McMeckin (1981) based on the derived exponential equation 3: (A) Streptococcus faecium: S = 100e-0.160T (n = 6, r = -0.962, p < 0.01); (B) Salmonella typhimurium: S = 100e-0.160T (n = 6, r = -0.938, p < 0.01); (C) Escherichia Coli: S = 100e-0.432T (n = 5, r = -0.896, p < 0.05); (D) Klebsiella pneumoniae: S = 100e-0.604T (n = 6, r = -0.938, p < 0.01).
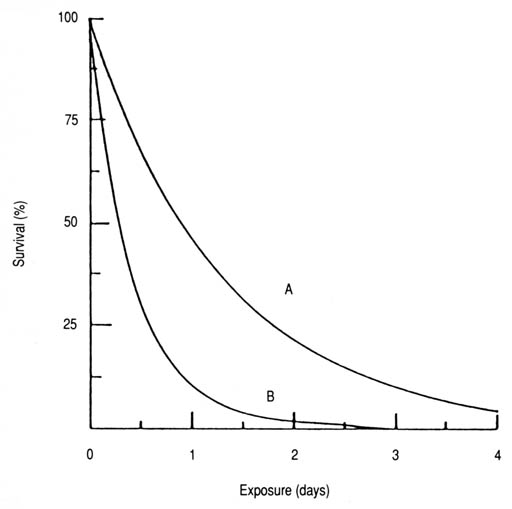 Fig. 26. Survival of Salmonella typhi in autoclaved (A) and untreated (B) seawater. Computer from Naabut and Kurayiyyah (1972) based on the derived exponential equation 3: (A): S = 100e-0.772T (n = 5, r = -0.992, p < 0.001, T99.99 = 6 days); (B): S = 100e-2.409T (n = 5, r = -0.972, p < 0.01, T99.9 = 2 days).
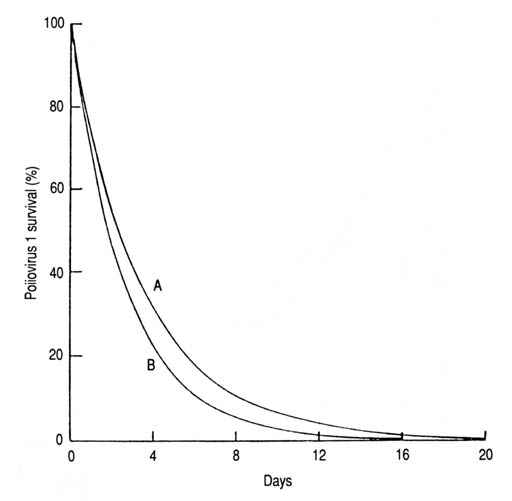 Fig. 27. Survival of poliovirus 1 on the surface of lettuce sprayed with inoculated sewage sludge (A) and sewafe effluent (B). Computed from Larin et al. (1976) based on the derived exponential equation 3: (A) S = 100e-0.272T (n = 10, r = -0.952, p < 0.001, T99.9 = 17 days); (B) S = 100e-0.372T (n = 7, r = -0.975, p < 0.001, T99.9 = 12 days). Special consideration should be given in future experiments to the potential for solar decontamination of water inoculated with such organisms as Legionella spp., which seems to be susceptible to artificial UV-B radiation (Antopol and Elner 1979; Gilpin et al. 1985; Voss et al. 1986), cholera bacillus, schistosomes (cercariae), and enteric viruses. Should these and similar organisms prove to be sensitive to the biocidal effect of solar radiation, then a great public health issue would have been resolved. | |||||||||||||||||||||||||||||||||||||||||||||||||||||||||||||||||||||||||||||||||||||||||||||||||